


The 'Great Resignation' is over and market history 101
The 'Great Resignation' is over and market history 101
The Sandbox Daily (6.8.2023)

Today’s Daily discusses:
the “Great Resignation” is over
brief history of bull and bear markets
timing of NBER recession calls
companies in public vs. private markets
global growth outlook weakest since GFC
We are in Manhattan at the JPMorgan Wealth Management Summit. Here is the highly respected investment strategist, Dr. David Kelly, delivering the opening remarks and his state of the markets presentation.

Let’s dig in.
Markets in review
EQUITIES: Nasdaq 100 +1.27% | S&P 500 +0.62% | Dow +0.50% | Russell 2000 -0.41%
FIXED INCOME: Barclays Agg Bond +0.53% | High Yield +0.63% | 2yr UST 4.517% | 10yr UST 3.718%
COMMODITIES: Brent Crude -1.79% to $75.57/barrel. Gold +1.12% to $1,980.4/oz.
BITCOIN: +1.14% to $26,634
US DOLLAR INDEX: -0.75% to 103.319
CBOE EQUITY PUT/CALL RATIO: 0.59
VIX: -2.08% to 13.65
Quote of the day
“Setting a financial goal is all about having your money serve you.”
- Brian Walsh, CFP at SoFi
The “Great Resignation” is over
During the past year, the rate at which Americans quit their jobs has steadily declined from a record high back to pre-pandemic levels – seemingly bringing an end to the labor market trend that came to be labeled as the “Great Resignation.”
The “Quits Rate” – the monthly rate of voluntary departures relative to total employment – fell to 2.4% in April, which is down from the 3% peak in April 2022 but still slightly elevated against the long-term average of 2%.
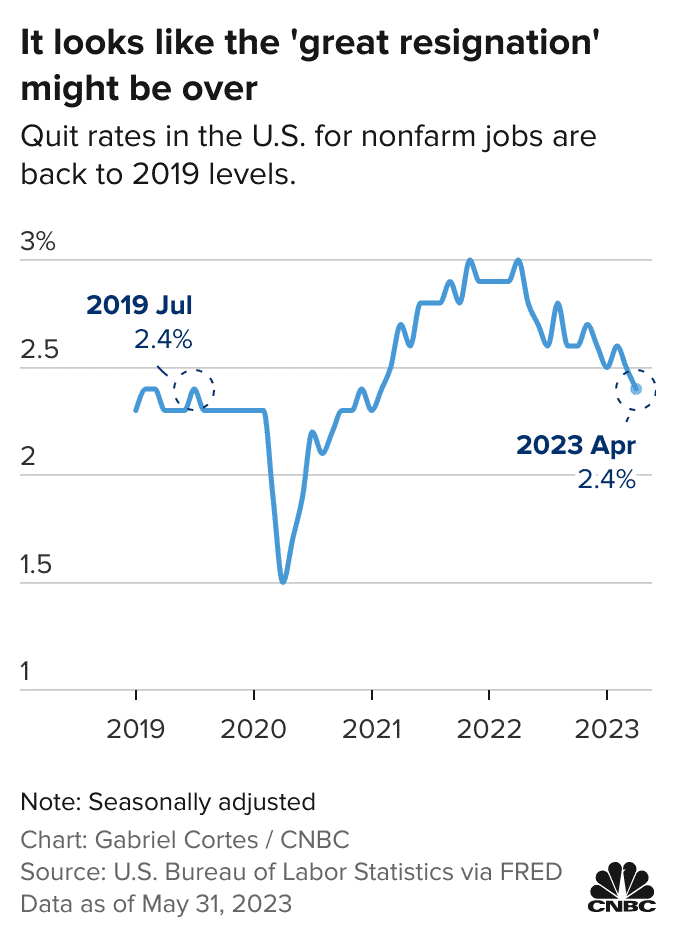
In 2022, more than 50 million U.S. workers left their jobs, the highest number of quits since the government started keeping track in 2000.
Abundant job opportunities, labor shortages, and significant pay increases for workers who changed jobs all contributed to this historic movement of people voluntarily quitting their jobs.
Source: Bureau of Labor Statistics, CNBC
Market history 101
The weight of historical evidence suggests that you should be long the market and accumulate shares in all environments, not just bull markets. No one ever seems to be upset when looking back at performance over 10- and 20-year time horizons.
After all, the S&P 500 Index (SPX) has been in a bull market for 83% of the last seven decades – that is statistically significant.
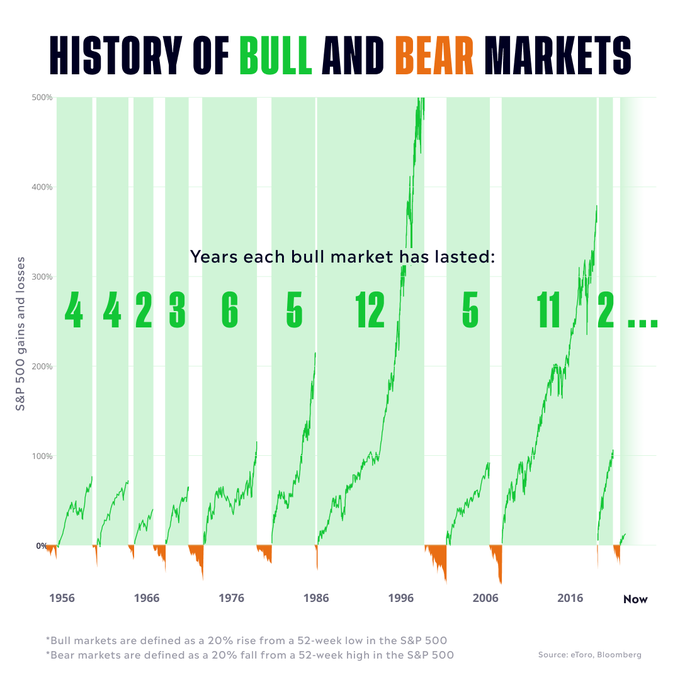
The magnitude and duration are the differentiating factors of each environment.

The average bull market gain over the last ~100 years is a +162% cumulative gain, while the average bear market loss is -41%. These short-term periods of uncomfortable drawdowns are the toll you must pay to achieve longer-term periods of wealth-building gains.
As to duration, bear markets can be brutal to stay invested, but are relatively short-lived on average (20 months) as compared to their bull counterparts (average 51 months).
As Nick Maggiulli says, just keep buying.
Source: Callie Cox, JPMorgan Guide to the Markets
Timing of National Bureau of Economic Research (NBER) recession calls
The National Bureau of Economic Research (NBER) is the official arbiter of labeling a recession for the U.S. economy. Here is the general gist of what the committee considers:
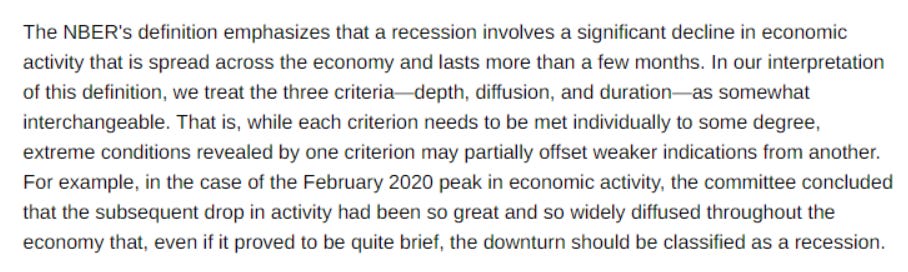
The timing of the NBER recession calls has been nearly coincident with recession-associated market bottoms, although the dispersion has been very wide – ranging from 10.4 months early to 6.5 months late. Typically, the NBER calls the recession an average of 6.6 months after it began, which is roughly at the same time when the market bottom is put in. Remember, the NBER’s job is not to forecast recessions but to date them. That is, they’re acting as economic historians rather than real-time diagnosticians – the call is made when they believe an economic peak or trough is “not in doubt” and can be accurately dated.
Market returns following the NBER call are good, up +6.5% on average 6 months later and up +15.6 on average 12 months later.

Some other fun data points from this exercise to consider…
The pre-recession market peak has occurred a median of 4.2 months before the recession starts; then, the market low has taken place a median of 5.2 months after the start of the recession.
The average peak-to-trough S&P 500 index (SPX) price decline associated with a recession has been -29.6% going back to 1937, covering 14 recessions.
Source: National Bureau of Economic Research, LPL Research
Companies in public vs. private markets
The number of publicly held companies is shrinking.
There are about three times as many PE-backed firms in the United States as there are publicly held companies. And when comparing the number of publicly-listed companies against VC-backed companies, the difference is almost inconceivable.
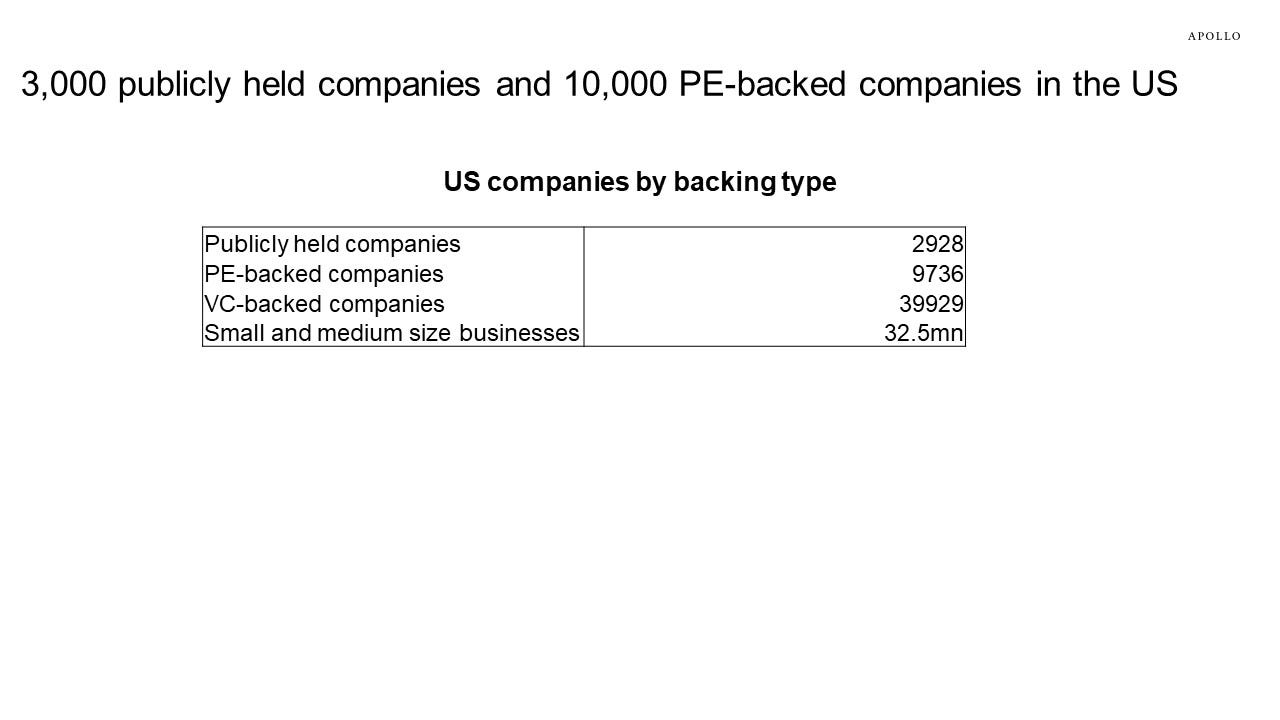
Companies generally stay private longer in current times, and with the cost of capital significantly higher than the last two decades, this will continue to put downward pressure on tech, growth equity, and venture capital.
Source: Apollo Global Management
Global growth outlook weakest since GFC
The Organization for Economic Cooperation and Development (OECD) published its updated global Economic Outlook report yesterday.
Global GDP growth is projected to be +2.7% in 2023, which is the lowest annual rate since the Global Financial Crisis, with exception to the COVID-19 pandemic time period of 2020."
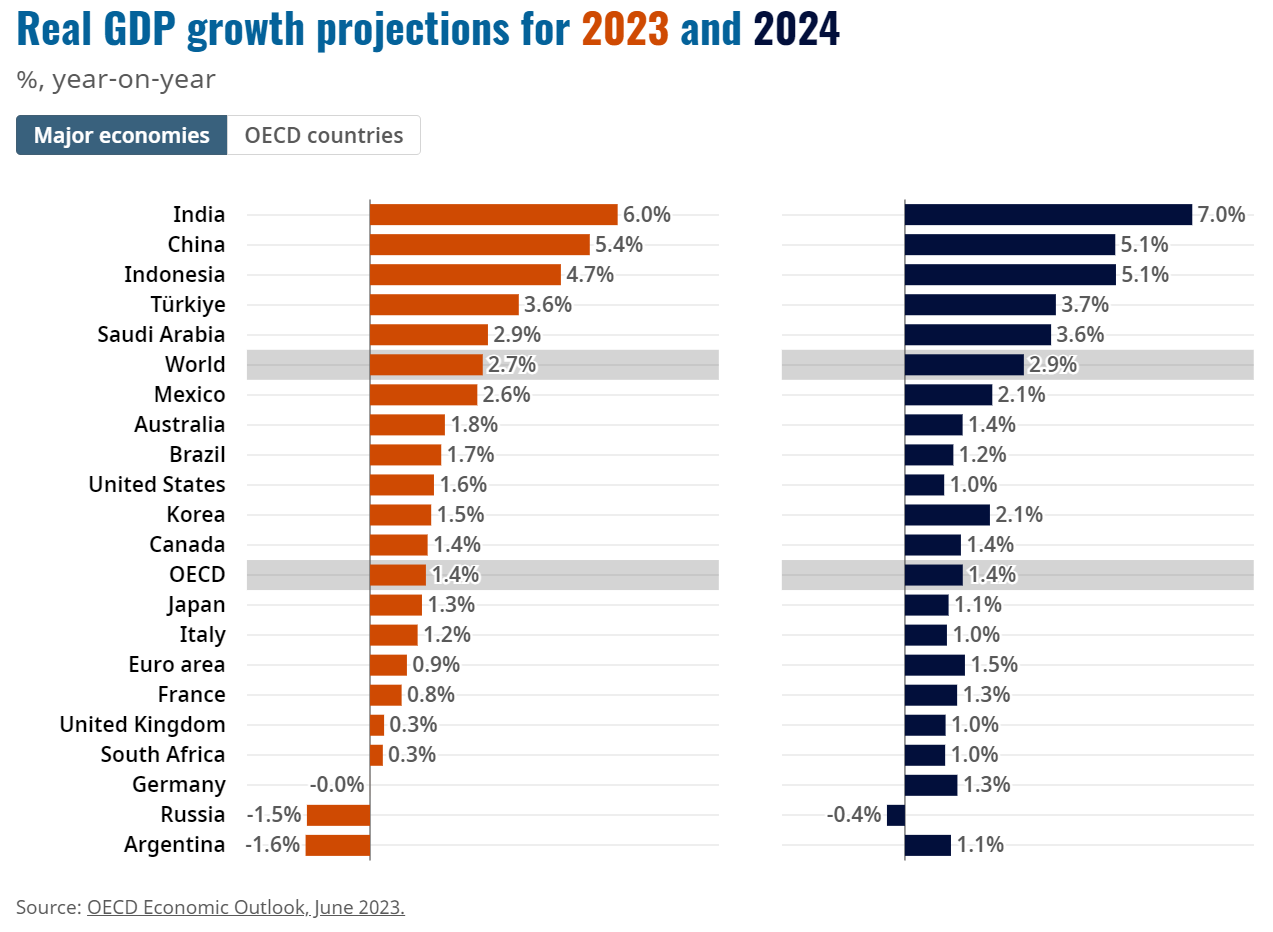
Source: Organization for Economic Co-operation and Development
That’s all for today.
Blake
Welcome to The Sandbox Daily, a daily curation of relevant research at the intersection of markets, economics, and lifestyle. We are committed to delivering high-quality and timely content to help investors make sense of capital markets.
Blake Millard is the Director of Investments at Sandbox Financial Partners, a Registered Investment Advisor. All opinions expressed here are solely his opinion and do not express or reflect the opinion of Sandbox Financial Partners. This Substack channel is for informational purposes only and should not be construed as investment advice. Clients of Sandbox Financial Partners may maintain positions in the markets, indexes, corporations, and/or securities discussed within The Sandbox Daily.