


SPY turns 30, plus the 60-40 portfolio, economic data flashes red, and the semis value chain
SPY turns 30, plus the 60-40 portfolio, economic data flashes red, and the semis value chain
The Sandbox Daily (1.23.2023)

Welcome, Sandbox friends.
Today’s Daily discusses the ongoing debate regarding the merits of the 60-40 portfolio, leading economic indicators are flashing red (again), the popular SPY exchange-traded fund turns 30, and the semiconductor value chain.
Let’s dig in.
Markets in review
EQUITIES: Nasdaq 100 +2.18% | Russell 2000 +1.25% | S&P 500 +1.19% | Dow +0.76%
FIXED INCOME: Barclays Agg Bond -0.25% | High Yield -0.01% | 2yr UST 4.232% | 10yr UST 3.521%
COMMODITIES: Brent Crude +0.52% to $88.09/barrel. Gold +0.21% to $1,948.9/oz.
BITCOIN: +2.45% to $22,980
US DOLLAR INDEX: +0.01% to 102.022
CBOE EQUITY PUT/CALL RATIO: 0.54
VIX: -0.20% to 19.81
Happy 30th to SPY
Launched on January 22nd, 1993, State Street’s SPDR S&P 500 ETF Trust (SPY) is celebrating its 30th anniversary since inception.

The fund, which seeks to track its underlying index of the S&P 500, was the very first exchange-traded fund (ETF) to launch in the United States. At ~$3.7 billion dollars of assets under management, the fund is the largest ETF product in the world as well as the most actively traded, with roughly ~$39 billion dollars of shares changing hands each trading day in 2022. The fund launched with $6.5 million in seed funding.
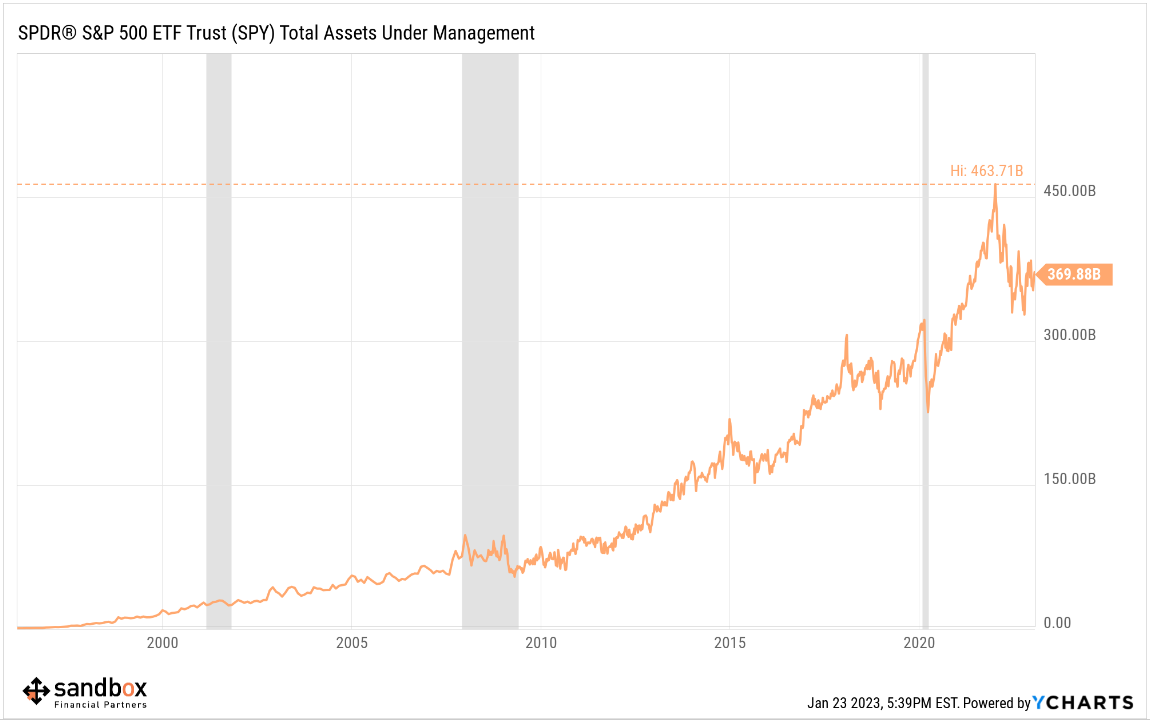
Since inception, SPY has handsomely rewarded its long-term shareholders, with the fund annualizing a +9.6% return spanning across three decades. The cumulative return is eye popping!
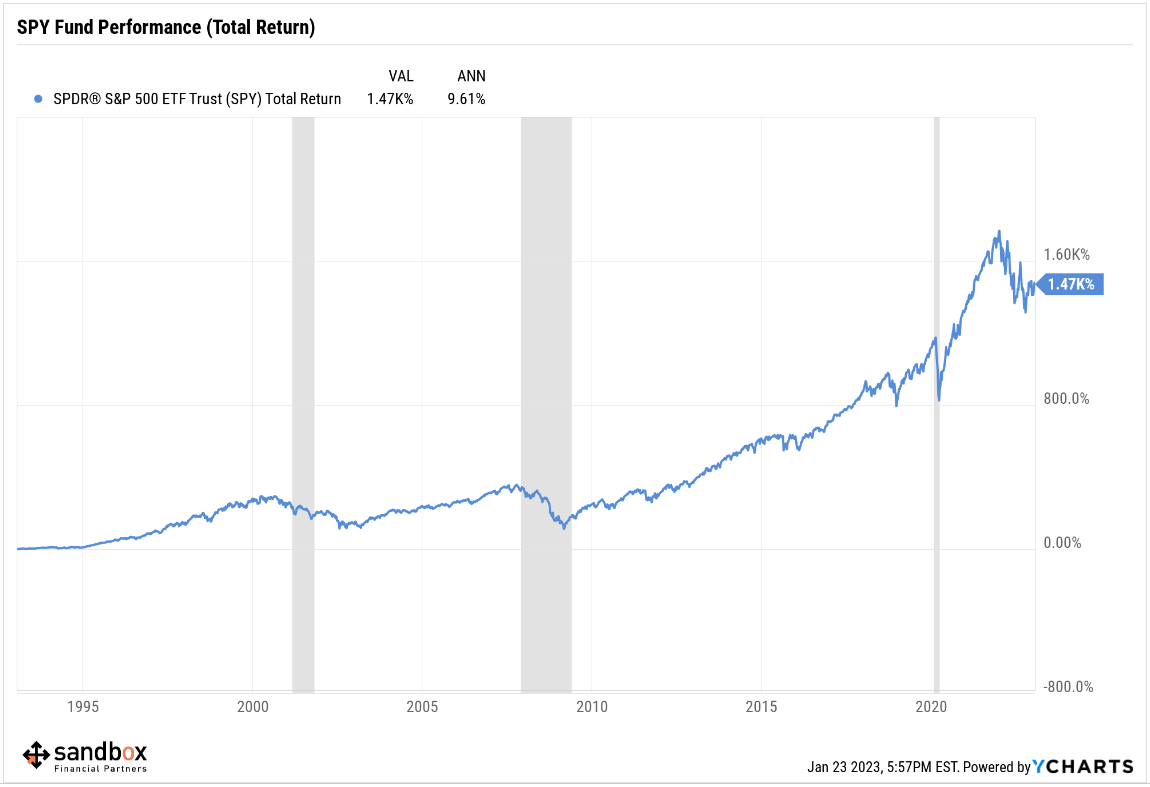
After a rough few years in the beginning, the fund gained traction among market participants, and the success of this ETF product across institutional and retail investors alike helped lay the foundational seeds to the rise of passive, index investing over the years to come.
Source: State Street, Financial Times, Benzinga
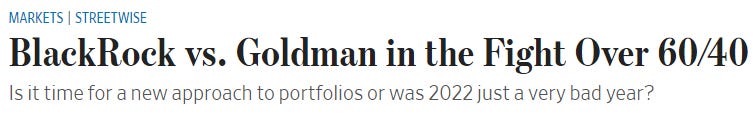
The 60-40 debate rages on
The 60-40 portfolio suffered mightily in 2022. This we know. Inflation wreaked havoc on the standard bogey portfolio. Look at the orange dot below; the lower left quadrant means losses for both stocks AND bonds.
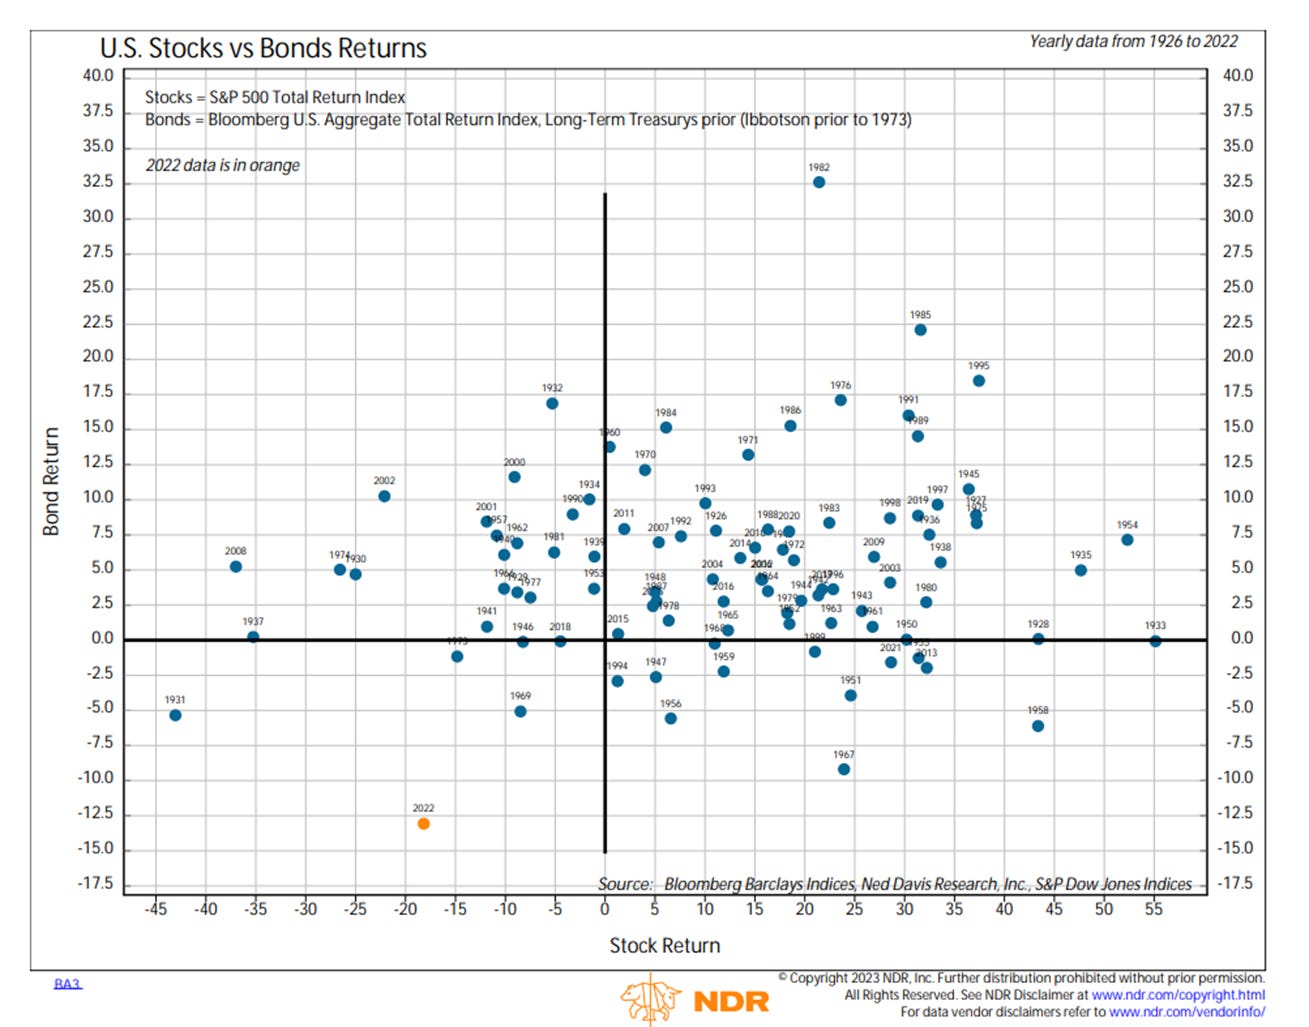
And when something doesn’t work, questions will naturally arise. From clients, from asset managers, from the marketing departments, etc. BlackRock says last years losses show the structure is outdated, while Goldman Sachs says this view goes too far and argues the occasional big loss is inevitable in any strategy over long periods of time.
One thing that is different is last year’s losses in bonds. The Bloomberg U.S. Aggregate Bond Index plunged -13.1%, its worst year on record since the index began in 1976. While the steep selloff is painful in the moment, it does offer bond investors their highest yields in more than a decade. And boy have investors noticed. Per the Wall Street Journal:
“Retail clients at brokerage firm Interactive Brokers LLC are trading four times as much in bonds now as they were in August. Cash flowing into corporate-bond mutual and exchange-traded funds hit a roughly two-year high in the week ended Jan. 11, according to data from Refinitiv Lipper.”
BlackRock ran a brief historical analysis on a 60-40 stock-bond portfolio allocation to show the different mix of assets required to achieve a 6.5% expected return. In 1999, the 6.5% expected return required the usual 60% allocation to stocks and 40% to bonds. In 2015, with many central banks around the world running zero-interest rate policy (ZIRP), it required an investor to shift capital away from bonds and invest as much as 80% in stocks to achieve the 6.5% hurdle -> taking on much more risk along the way. Today? The pendulum has swung back the other way; BlackRock argues the desired target can be achieved by investing just 35% in equities because yields are so attractively priced in this environment.
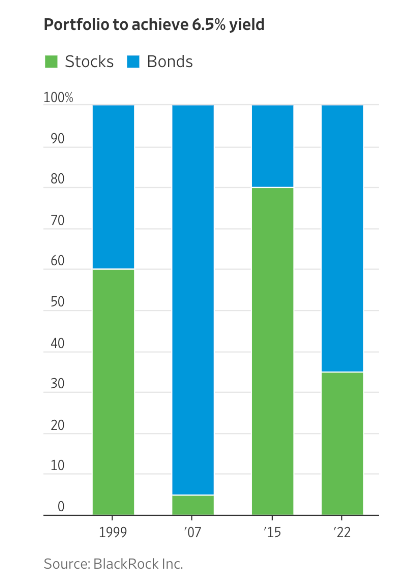
Overweighting bonds to this degree suggests BlackRock is positioned in a way that global growth will slow corporate earnings and cause equity multiples to further de-rate, while bonds will continue to paying higher yields as the Fed holds to their “higher for longer” policy in 2023.
Source: Ned Davis Research, Wall Street Journal, BlackRock
Leading economic indicators are flashing red (again)
The Conference Board publishes leading, coincident, and lagging indexes designed to signal peaks and troughs in the business cycle for major global economies. Today we’re looking at the Leading Economic Index, which made headlines today.
The Conference Board’s Leading Economic Index (LEI) fell -1.0% in December, following a downwardly revised -1.1% drop in the month before, and worse than the consensus of -0.7%. That marks a -4.2% drop in the second half of 2022, which was much steeper than the -1.9% contraction in the first half of 2022. It’s also the 10th consecutive months of decline.
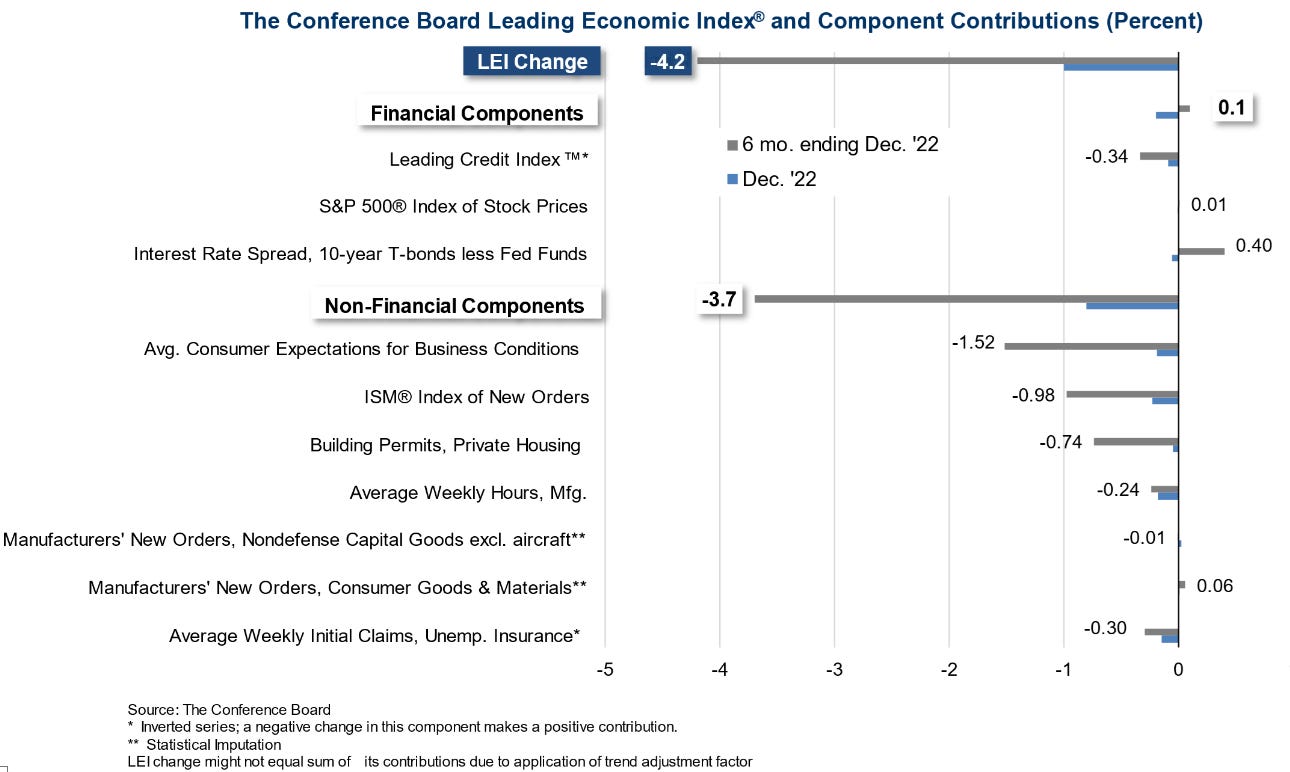
Clearly the forward-looking indicators suggest enduring, widespread weakness across the economy. While no forecasting system is perfect, this one has a pretty good track record.
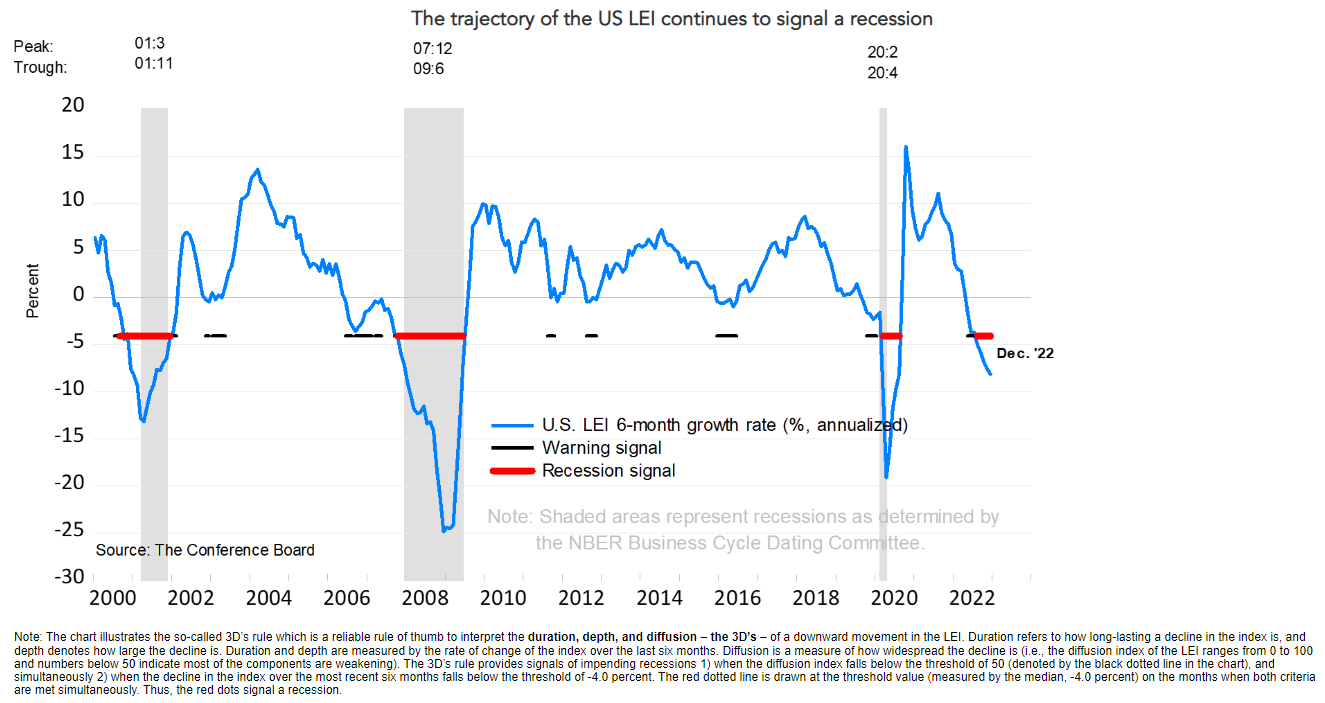
In a note before Monday’s press release, investment strategist Ed Yardeni pointed out that, on average, the index has peaked 12 months before a downturn in the business cycle. Ed writes, “The LEI’s recession alarm is sounding loud and clear and is signaling an imminent recession.”
Source: The Conference Board, Ned Davis Research, StockTwits
One simple graphic
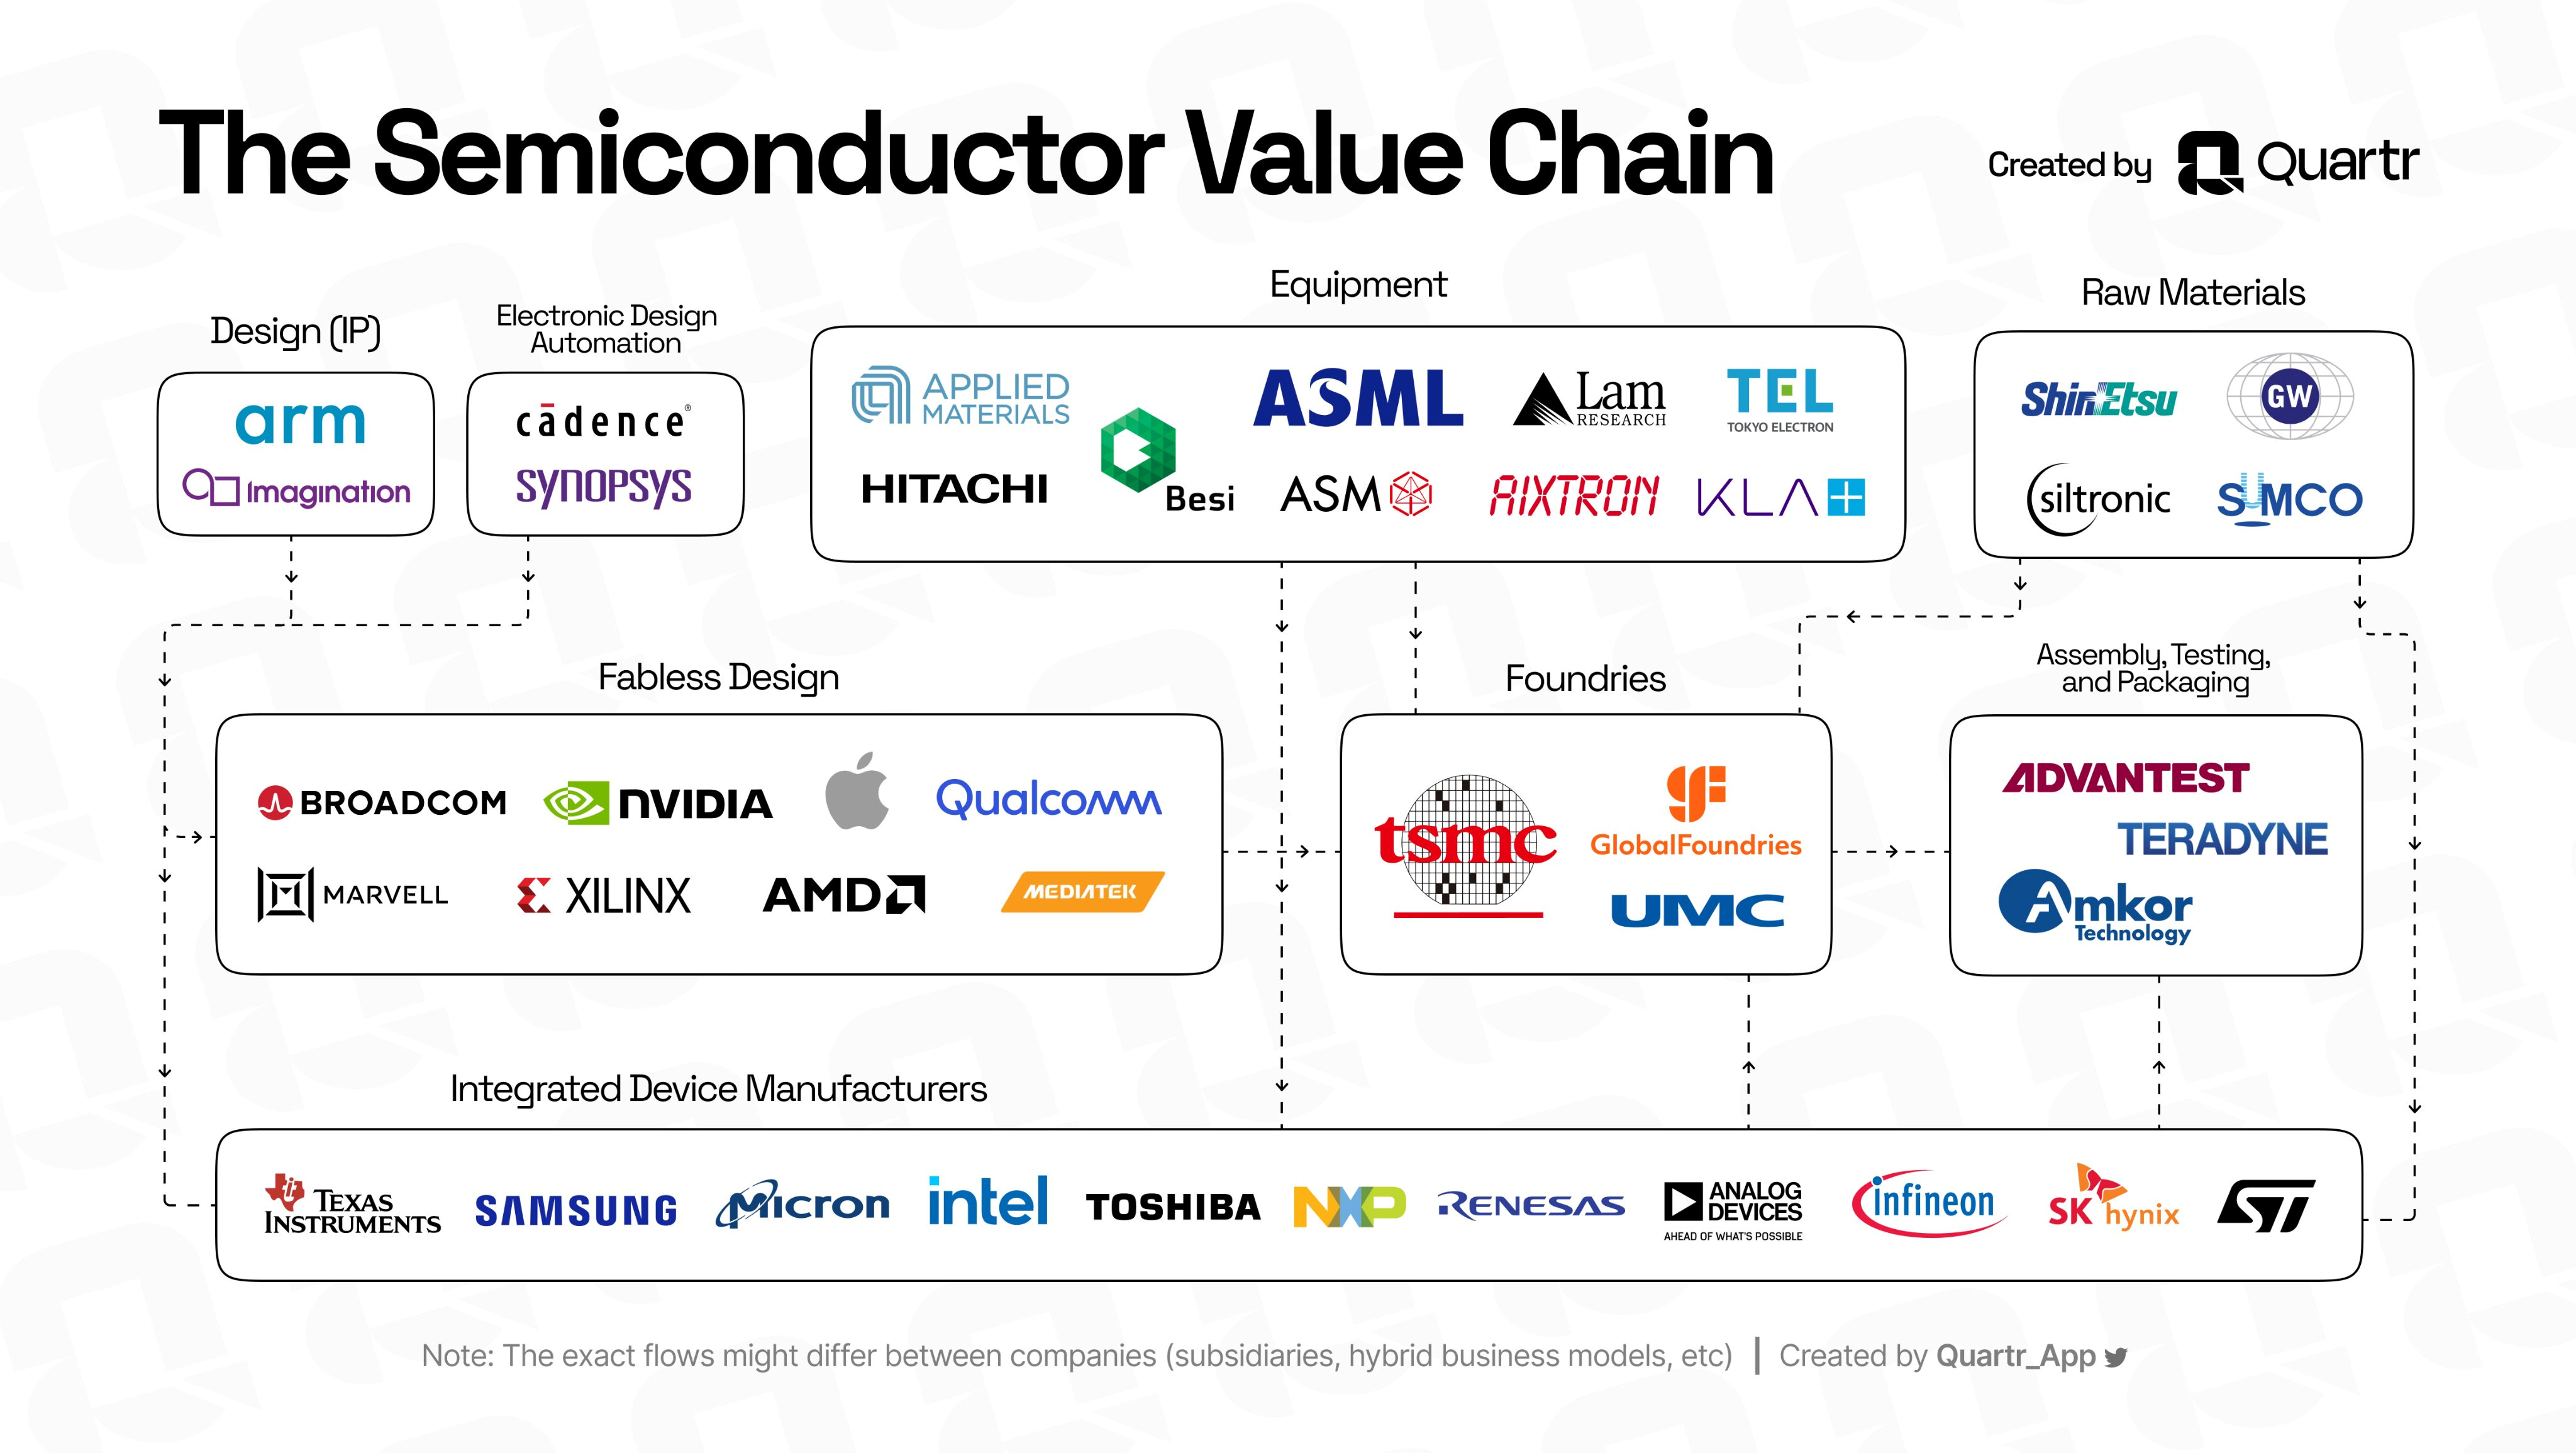
The semiconductor space can be complex and confusing so Quartr created this (non-exhaustive) infographic explaining the dynamics of semiconductor manufacturing, showing how key players like Lam Research (LRCX), Nvidia (NVDA), Texas Instruments (TXN), Taiwan Semiconductor Manufacturing Co (TSM) fit in the value chain.
Source: Quartr
That’s all for today.
Blake
Welcome to The Sandbox Daily, a daily curation of relevant research at the intersection of markets, economics, and lifestyle. We are committed to delivering high-quality and timely content to help investors make sense of capital markets.
Blake Millard is the Director of Investments at Sandbox Financial Partners, a Registered Investment Advisor. All opinions expressed here are solely his opinion and do not express or reflect the opinion of Sandbox Financial Partners. This Substack channel is for informational purposes only and should not be construed as investment advice. Clients of Sandbox Financial Partners may maintain positions in the markets, indexes, corporations, and/or securities discussed within The Sandbox Daily.