


Seasonal trends for June, plus long-term market returns, financials and small-caps, AI warning, and April's JOLTS report
Seasonal trends for June, plus long-term market returns, financials and small-caps, AI warning, and April's JOLTS report
The Sandbox Daily (5.31.2023)

Welcome, Sandbox friends.
Today’s Daily discusses:
what to expect in June
long-term market returns
big levels for the laggards
risk of extinction from the computers?
fresh batch of labor data shows unwavering labor market strength
Let’s dig in.
Markets in review
EQUITIES: Dow -0.41% | S&P 500 -0.61% | Nasdaq 100 -0.70% | Russell 2000 -1.00%
FIXED INCOME: Barclays Agg Bond +0.36% | High Yield -0.31% | 2yr UST 4.409% | 10yr UST 3.646%
COMMODITIES: Brent Crude -1.20% to $72.71/barrel. Gold +0.23% to $1,982.1/oz.
BITCOIN: -2.48% to $27,108
US DOLLAR INDEX: +0.06% to 104.232
CBOE EQUITY PUT/CALL RATIO: 0.51
VIX: +2.75% to 17.94
Quote of the day
“Small changes often appear to make no difference until you cross a critical threshold. The most powerful outcomes of any compounding process are delayed. You need to be patient.”
- James Clear, Atomic Habits
What to expect in June
Don’t expect any seasonal tailwinds for stocks next month.
The S&P 500 index has generated average and median price returns for June of 0.0% and 0.1%, respectively, making it the 4th worst-performing month since 1950.
Furthermore, the index has only produced positive returns 54.8% of the time during June.

For context, the S&P 500 has posted average monthly returns of +0.7% and finished positive 61% of the time for all months since 1950.
Source: LPL Research
Long-term market returns
How often is the stock market positive?
Looking at rolling monthly returns over the last roughly 100 years, the U.S. stock market has never had negative returns over a 20-year window. The only 15-year return that went negative was the year ending in 1944, a time period bookended by the Great Depression and World War II. Rolling 7- and 10-year periods are higher 95% of the time.
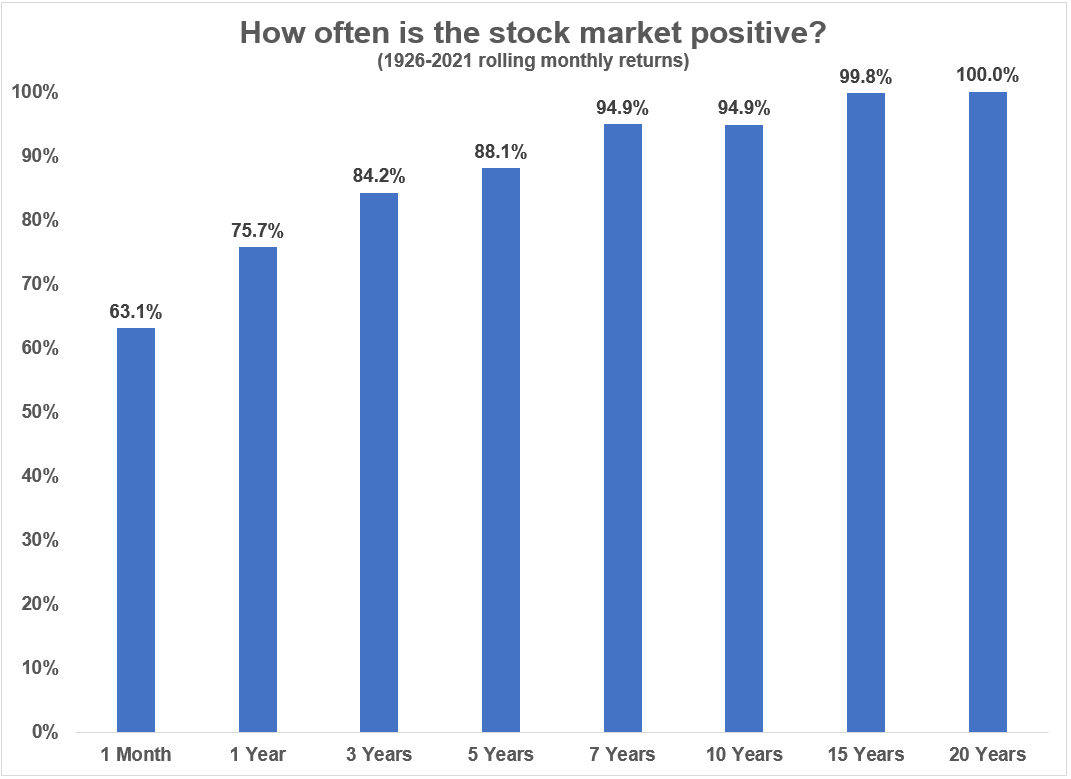
The shorter your time horizon, the higher the likelihood you will experience losses. And the longer your time horizon, the better your chances you will experience gains.
Source: Ben Carlson
Big levels for the laggards
Despite all the bullish developments of the past few weeks, it’s always important to consider the potential bearish thesis, which comes down to the value and cyclical groups.
While this means things like energy, materials, and industrials, it also means financials. When it comes to the major averages, the large-cap indexes like the S&P and the Nasdaq have a tilt toward growth. However, the small-cap Russell 2000 (IWM) has a tilt toward value. For this reason, the stock chart resembles the large-cap Financial Sector SPDR (XLF).
Here are both charts, zoomed out to the prior cycle highs:

As long as the 2018 and 2020 pre-COVID highs hold, the primary trends remain intact. And the longer these key levels hold, the more likely it is that these underperforming groups eventually play catch-up to tech stocks and other leaders.
Considering all the bullish data points we’re getting from other areas of the market, these stocks may soon get their act together and begin trending higher as well. But it would need to happen ASAP, as these indexes and others are vulnerable at current levels.
Source: All Star Charts
Risk of extinction?
A group of top AI researchers, engineers, and CEOs issued a new warning about the existential threat they believe that artificial intelligence poses to humanity.
The succinct risk statement, clocking in at just 22 words, was signed by the CEOs of Google’s Deepmind, OpenAI, and Anthropic, but notably missing was Elon Musk.

The short statement – published by a San Francisco-based non-profit group – was likely deliberate to avoid controversy, increase signature count, and make it as broadly acceptable as possible.
Source: Center for AI Safety, TechCrunch
JOLTS report shows unwavering labor market strength
Every month, we turn to the Labor Department's Job Openings and Labor Turnover (JOLTS) survey to understand the ebbs and flows of what's really happening among businesses and their workers.
The number of job openings that employers reported in April rebounded by +3.7% to 10.1 million, its first increase this year and contrary to the consensus for a continued slide to 9.5 million. Even though job openings have declined somewhat from their cyclical peak in 2022 (12.0 million in March 2022), they continue to exceed the number of unemployed by a wide margin and suggests labor demand in aggregate remains strong.

Elsewhere, the report showed that the ratio of job openings to unemployed Americans picked up to 1.79 from 1.67 – still below the cycle peak of 1.99 – indicating a persistent labor demand/supply imbalance and is consistent with continued upward pressure on wage growth.
The one indicator in this report that pointed to some easing in labor market conditions was the Quit Rate. It fell to 2.4%, its lowest level since February 2021 and within a tick of its pre-pandemic level of 2.3%. It shows some cooling in worker optimism about their job prospects and suggests that the wage premium of job switchers over job stayers should decline in the coming months.
Source: Ned Davis Research, Bloomberg
That’s all for today.
Blake
Welcome to The Sandbox Daily, a daily curation of relevant research at the intersection of markets, economics, and lifestyle. We are committed to delivering high-quality and timely content to help investors make sense of capital markets.
Blake Millard is the Director of Investments at Sandbox Financial Partners, a Registered Investment Advisor. All opinions expressed here are solely his opinion and do not express or reflect the opinion of Sandbox Financial Partners. This Substack channel is for informational purposes only and should not be construed as investment advice. Clients of Sandbox Financial Partners may maintain positions in the markets, indexes, corporations, and/or securities discussed within The Sandbox Daily.