


Pre-election year cycles, plus stocks at critical resistance, Tech, and purchasing power
Pre-election year cycles, plus stocks at critical resistance, Tech, and purchasing power
The Sandbox Daily (1.24.2023)

Welcome, Sandbox friends.
Today’s Daily discusses the stock market performance in pre-election year cycles (i.e. 2023), U.S. stocks trading around critical resistance, Tech upside risk most exposed to an improving global macro picture, and inflation eroding your purchasing power.
Let’s dig in.
Markets in review
EQUITIES: Dow +0.31% | S&P 500 -0.07% | Nasdaq 100 -0.22% | Russell 2000 -0.27%
FIXED INCOME: Barclays Agg Bond +0.44% | High Yield +0.07% | 2yr UST 4.211% | 10yr UST 3.455%
COMMODITIES: Brent Crude -2.09% to $86.35/barrel. Gold +0.52% to $1,955.6/oz.
BITCOIN: -0.81% to $22,789
US DOLLAR INDEX: -0.21% to 101.925
CBOE EQUITY PUT/CALL RATIO: 0.53
VIX: -3.08% to 19.20
Election cycles
Understanding market cycles over time presents investors with information.
Historically, year 3 of the Presidential cycle – the Pre-Election year – is the most bullish part of the 4-year cycle. Since 1873, stocks have averaged a positive return of +11.8% and finished green 70% of the time.

And here is the Presidential election cycle composite data since 1950 (blue line) as compared to the price action under President Biden’s term (red line):
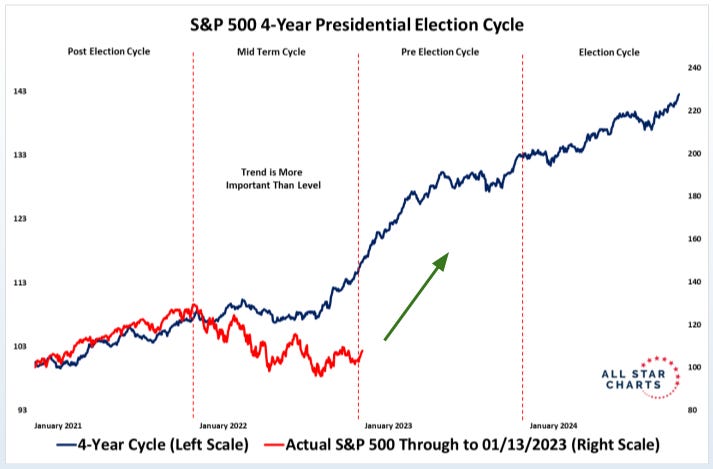
Source: FS Insight, All Star Charts
Breakouts or fakeouts?
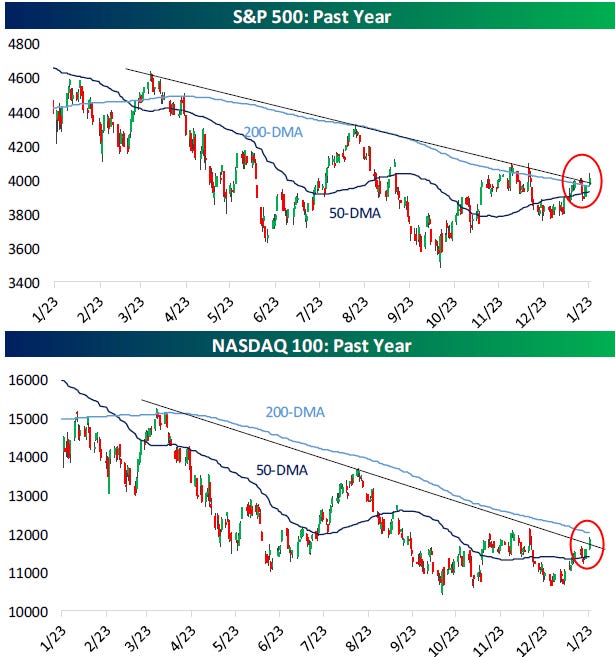
The S&P 500 and Nasdaq 100 managed to trade above their one-year downtrend channels yesterday, the same resistance line that stopped all rallies last year. It's a positive move, but will it be another head fake or the start of a trend higher?
Traders will now be looking for the two stock market indices to break above their late November/early December highs -- which would represent a "higher high" after we just saw a "higher low" for stock indices earlier this month. A "confirmed" break higher could propel the indices above the critical resistance defining these bearish downtrends.
Higher Low = ✅
Higher High =❓
A higher-high would trigger a new short-term uptrend formation, which is something we haven't seen since last summer.
How do these patterns resolve themselves over the coming weeks? A lot may ride on the Fed meeting next week, how investors perceive their tone, and what they may or may not do in the coming months. Then we get next Friday's unemployment report and the CPI report in the following week to update investors' economic and inflation views. In the background, we also have companies reporting 4th quarter earnings. A lot for the market to digest and should help shape market direction over the coming weeks and months.
Source: Bespoke Investment Management
Tech upside risk most exposed to improving global macro
Rebounding global growth and a falling U.S. dollar could help tech stock outperformance in the future.
While recent economic data in the United States have sent mixed signals, the growth outlooks in China and Europe have improved markedly. Economists at Goldman Sachs upgraded their GDP forecasts in both regions and no longer expect a Euro area recession this winter.
The shifting growth outlook should benefit international-facing sectors more than the headline index but will not be the only factor that drives performance. Foreign revenue exposure varies dramatically at the sector level. Info Tech derives the largest share of its revenues from abroad, with 15% from China and a combined 59% from non-U.S. regions. The next-most exposed sectors are Materials and Energy.
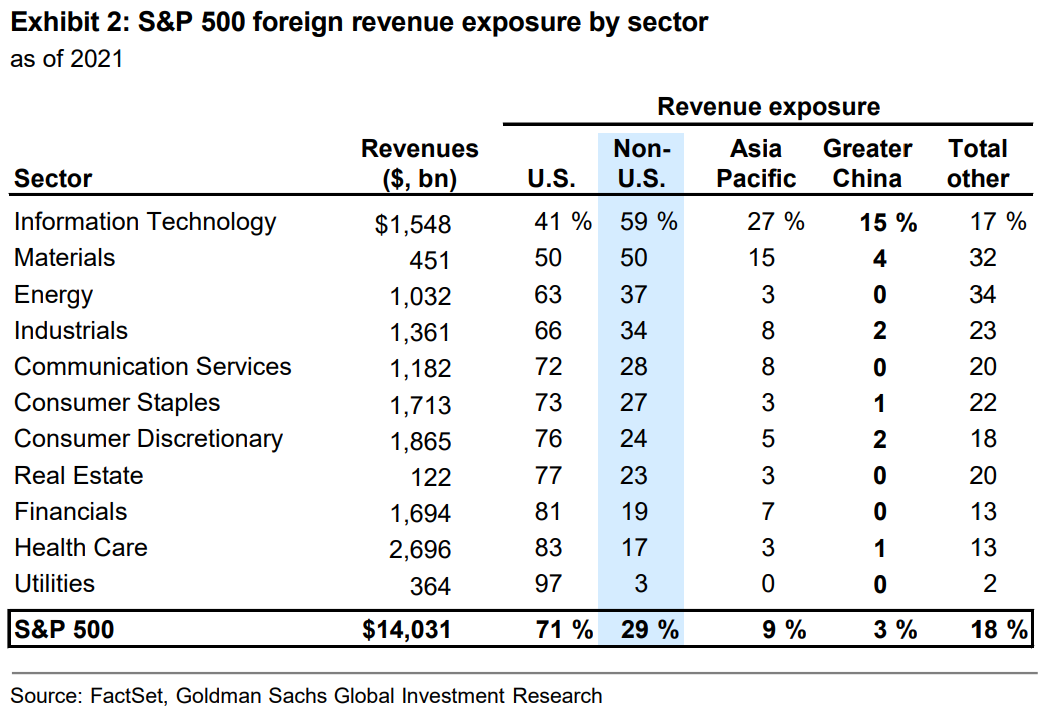
Source: Goldman Sachs Investment Research
One simple graphic
Inflation is a dangerous thing for those who sit on cash and do not invest.
If you don’t want to lose purchasing power of your hard-earned dollars, you must invest in assets that outpace inflation.
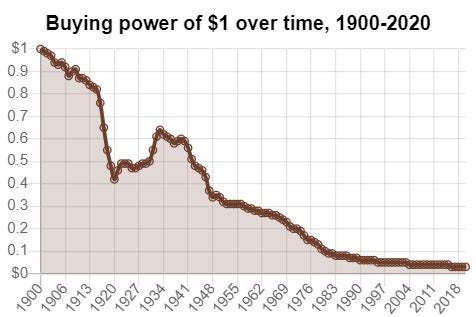
Source: Compounding Quality
That’s all for today.
Blake
Welcome to The Sandbox Daily, a daily curation of relevant research at the intersection of markets, economics, and lifestyle. We are committed to delivering high-quality and timely content to help investors make sense of capital markets.
Blake Millard is the Director of Investments at Sandbox Financial Partners, a Registered Investment Advisor. All opinions expressed here are solely his opinion and do not express or reflect the opinion of Sandbox Financial Partners. This Substack channel is for informational purposes only and should not be construed as investment advice. Clients of Sandbox Financial Partners may maintain positions in the markets, indexes, corporations, and/or securities discussed within The Sandbox Daily.